PieChart from Json Array in Sketchware

1. Create a new project in Sketchware.
2. In main.xml add a Button button2 and a ListView listview2.
3. Create a CustomView items.xml and add two TextViews in it textview1 and textview2.

5. In MainActivity.java, add a Shared Preferences component sp:sp, and an Intent component i.

6. Add a String variable jsondata, and a ListMap maplist.
7. In onCreate event use blocks to set jsondata to your Json data containing 'text' and 'number' as keys. Convert it to List Map maplist and display it in ListView.

[
{
"text" : "Afghan Afghani",
"number" : "0.9532"
},
{
"text" : "Armenian Dram",
"number" : "0.1487"
},
{
"text" : "Bangladeshi Taka",
"number" : "0.8572"
},
{
"text" : "Cambodian Riel",
"number" : "0.1758"
},
{
"text" : "Indonesian Rupiah",
"number" : "0.005"
},
{
"text" : "Maldivian Rufiyaa",
"number" : "4.674"
},
{
"text" : "Pakistani Rupee",
"number" : "0.5832"
},
{
"text" : "Philippine Peso",
"number" : "1.332"
},
{
"text" : "Thai Baht",
"number" : "2.226"
}
]
8. In onBindCustomView event, display the data from maplist in the TextViews in CustomView items.xml.

9. Create a new View piechart.xml.
10. In the event button2 onClick in MainActivity.java, save the maplist to Shared Preferences and use Intent to move to PiechartActivity.java.

12. In PiechartActivity.java add a Shared Preferences component sp:sp, a Map variable map, and a ListMap listmap.
13. In onCreate event use blocks to get data from Shared Preferences to listmap, and codes to display this ListMap in PieChartView.
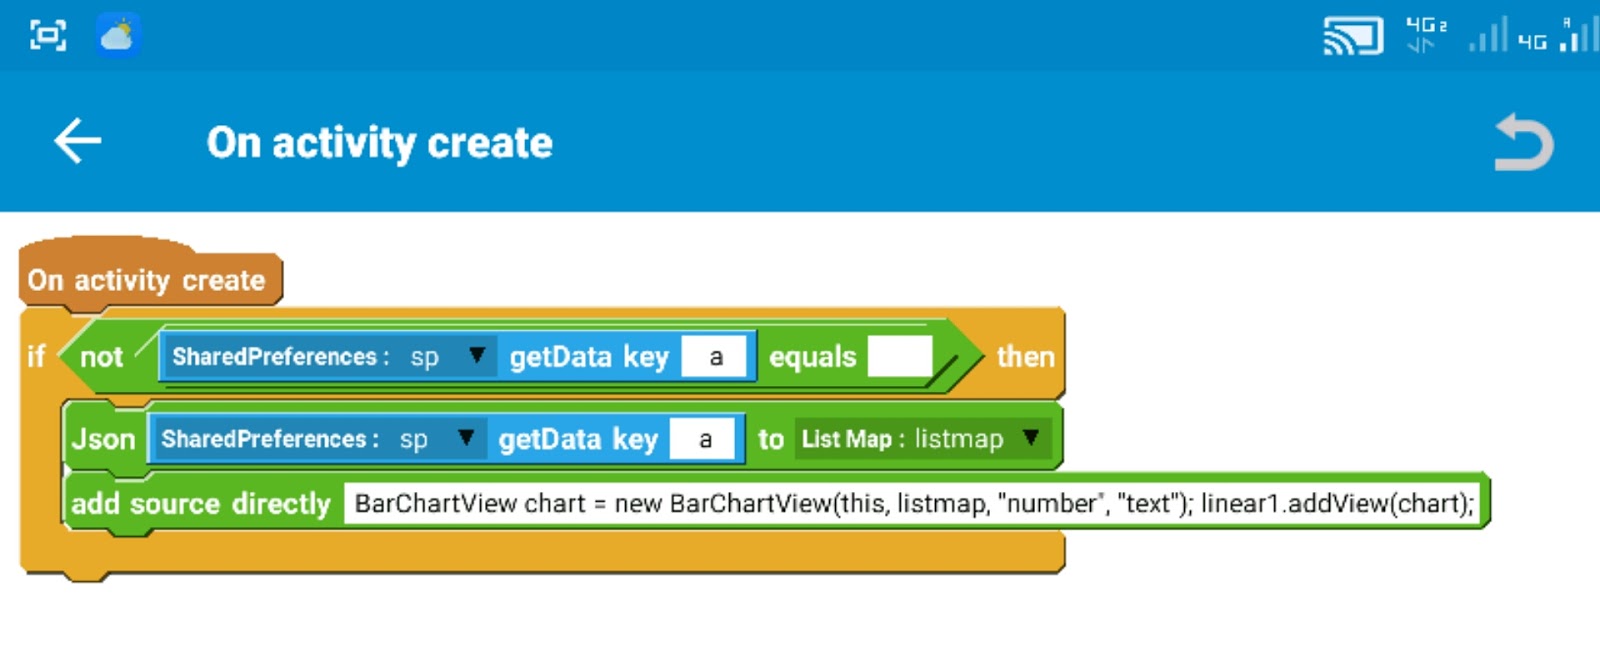
PieChartView chart = new PieChartView(this, listmap, "number", "text");
linear1.addView(chart);
Here 'text' and 'number' are the keys used in Json String in MainActivity.java.
14. Create a More Block extra.

15. In the more block extra, use an add source directly block and put codes to define a View class PieChartView.
}
public class PieChartView extends View {
private Paint fillPaint;
private Paint strokePaint;
private ArrayList<HashMap<String, Object>> list = new ArrayList<>();
private String numkey;
private String labelkey;
public PieChartView(Context context, ArrayList<HashMap<String, Object>> list, String numkey, String labelkey){
super(context);
fillPaint = new Paint();
strokePaint = new Paint();
this.list = list;
this.numkey = numkey;
this.labelkey = labelkey;
}
@Override
protected void onDraw(Canvas canvas) {
int viewWidth = this.getMeasuredWidth();
int viewHeight = this.getMeasuredHeight();
float startAngle = 0;
float sweepAngle = 0;
int lineHeight = 0;
float total = 0;
for (int i =0; i<list.size(); i++){
total = total + Float.valueOf(list.get(i).get(numkey).toString());
}
fillPaint.setStyle(android.graphics.Paint.Style.FILL);
strokePaint.setStyle(android.graphics.Paint.Style.STROKE);
strokePaint.setStrokeWidth(2);
strokePaint.setColor(Color.BLACK);
for (int i =0; i<list.size(); i++){
int col = 100+(155*i/list.size());
fillPaint.setColor(Color.rgb(40, col, col));
startAngle = startAngle+sweepAngle;
sweepAngle = 360*Float.valueOf(list.get(i).get(numkey).toString())/total;
canvas.drawArc(80, 40, viewWidth-80, viewWidth-120, startAngle, sweepAngle, true, fillPaint);
canvas.drawArc(80, 40, viewWidth-80, viewWidth-120, startAngle, sweepAngle, true, strokePaint);
lineHeight = lineHeight + 80;
canvas.drawRect(40, viewWidth - 120 + lineHeight - 40, 80, viewWidth - 120+ lineHeight, fillPaint);
fillPaint.setColor(Color.BLACK); fillPaint.setTextSize(40); canvas.drawText(list.get(i).get(labelkey).toString() + " : " + list.get(i).get(numkey).toString(), 100, viewWidth - 120+ lineHeight, fillPaint);
}
}
This code only works for positive values.
For using random colors for the PieChart, in code above change
int col = 100+(155*i/list.size());
fillPaint.setColor(Color.rgb(40, col, col));
to
int r = getRandom(0, 255);
int g = getRandom(0, 255);
int b = getRandom(0, 255);
fillPaint.setColor(Color.rgb(r, g, b));
16. Save and Run the project.


bro plz reply my comment
ReplyDeleteplz, you have Facebook account?
ReplyDeleteHow to create one time login system?
ReplyDeleteCompilation error
ReplyDeleteError: invalid character Pointing to the line height
Hello Sanjeev Kumar, i have a question , so i have more than ten values on my map, it's about 22 values and there don't have enough space on the screen to show all of them, i tried to use a scroll view but it didn't work properly.
ReplyDeleteYou can add an onTouchListener to the Pie Chart and show the name of the sector touched
DeleteHow to show storage memory in sketchware (with percent and show GB)
ReplyDeleteYour tutorials are helpful and thank you for sharing.
ReplyDeleteI have a doubt, how can i fit the drawer area on to a linearview?
I tried changing
int viewWidth = this.getMeasuredWidth();
int viewHeight = this.getMeasuredHeight();
to
int viewWidth = vlayout1.getMeasuredWidth();
int viewHeight = vlayout1.getMeasuredHeight();
where vlayout is vertical linear and has height fixed at 300.
With this setting only half of the pie chart is visible.
Can you help me?