Pie Chart View in Sketchware
1. Create a new project in Sketchware.
2. In main.xml add two Buttons button1 and button2, and a ListView listview2.
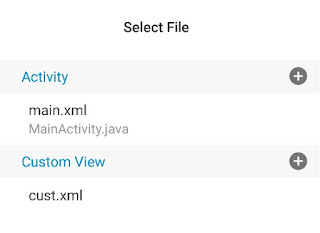
4. Select items.xml as CustomView of listview2.
5. In MainActivity.java, add a Shared Preferences component sp:sp, a Dialog component dialog_add, and an Intent component i.
6. Add a Map variable map, three String variables jsondata, label and value, and a ListMap maplist.
7. In onCreate event use blocks to get data from shared preferences to maplist and display it in ListView.
8. In onBindCustomView event, display the data from maplist in the TextViews in CustomView items.xml.
9. Create a CustomView dialog_view.xml containing LinearLayout linear2 and linear3 for adding EditText fields created programmatically.
10. In the event button1 onClick (Add Button), use blocks to display a Custom Dialog Box which can be used to add data to the list.
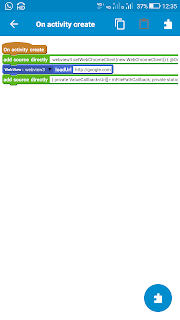
The code in first add source directly block in the image above, creates two EditText programmatically, adds them to the LinearLayouts in CustomView dialog_view.xml, and sets the CustomView as View of the Dialog.
final EditText dialog_edittext1 = new EditText(MainActivity.this);
dialog_edittext1.setLayoutParams(new LinearLayout.LayoutParams(LinearLayout.LayoutParams.MATCH_PARENT, LinearLayout.LayoutParams.WRAP_CONTENT));
dialog_edittext1.setHint("Text");
final EditText dialog_edittext2 = new EditText(MainActivity.this);
dialog_edittext2.setLayoutParams(new LinearLayout.LayoutParams(LinearLayout.LayoutParams.MATCH_PARENT, LinearLayout.LayoutParams.WRAP_CONTENT));
dialog_edittext2.setHint("Number");
dialog_edittext2.setInputType(InputType.TYPE_CLASS_NUMBER | InputType.TYPE_NUMBER_FLAG_DECIMAL | InputType.TYPE_NUMBER_FLAG_SIGNED);
View inflated_view = getLayoutInflater().inflate(R.layout.dialog_view, null);
LinearLayout dialog_linear1 = inflated_view.findViewById(R.id.linear2);
LinearLayout dialog_linear2 = inflated_view.findViewById(R.id.linear3);
dialog_linear1.addView(dialog_edittext1);
dialog_linear2.addView(dialog_edittext2);
dialog_add.setView(inflated_view);
The code used in second add source directly block in the image above, gets the data from EditText fields to the String variables.
label = dialog_edittext1.getText().toString();
value = dialog_edittext2.getText().toString();
11. Create a new View piechart.xml.
12. In the event button2 onClick in MainActivity.java, save the maplist to Shared Preferences and used Intent to move to PiechartActivity.java.
14. In PiechartActivity.java add a Shared Preferences component sp:sp, a Map variable map, and a ListMap listmap.
15. In onCreate event use blocks to get data from Shared Preferences to listmap, and codes to display this ListMap in PieChartView.
The code used in add source directly block is
PieChartView chart = new PieChartView(this, listmap, "number", "text");
linear1.addView(chart);
Here 'text' and 'number' are the keys used to add items to List Map in MainActivity.java.
16. Create a More Block extra.
17. In the more block extra, use an add source directly block and put codes to define a View class PieChartView.
}
public class PieChartView extends View {
private Paint fillPaint;
private Paint strokePaint;
private ArrayList<HashMap<String, Object>> list = new ArrayList<>();
private String numkey;
private String labelkey;
public PieChartView(Context context, ArrayList<HashMap<String, Object>> list, String numkey, String labelkey){
super(context);
fillPaint = new Paint();
strokePaint = new Paint();
this.list = list;
this.numkey = numkey;
this.labelkey = labelkey;
}
@Override
protected void onDraw(Canvas canvas) {
int viewWidth = this.getMeasuredWidth();
int viewHeight = this.getMeasuredHeight();
float startAngle = 0;
float sweepAngle = 0;
int lineHeight = 0;
float total = 0;
for (int i =0; i<list.size(); i++){
total = total + Float.valueOf(list.get(i).get(numkey).toString());
}
fillPaint.setStyle(android.graphics.Paint.Style.FILL);
strokePaint.setStyle(android.graphics.Paint.Style.STROKE);
strokePaint.setStrokeWidth(2);
strokePaint.setColor(Color.BLACK);
for (int i =0; i<list.size(); i++){
int col = 100+(155*i/list.size());
fillPaint.setColor(Color.rgb(40, col, col));
startAngle = startAngle+sweepAngle;
sweepAngle = 360*Float.valueOf(list.get(i).get(numkey).toString())/total;
canvas.drawArc(80, 40, viewWidth-80, viewWidth-120, startAngle, sweepAngle, true, fillPaint);
canvas.drawArc(80, 40, viewWidth-80, viewWidth-120, startAngle, sweepAngle, true, strokePaint);
lineHeight = lineHeight + 80;
canvas.drawRect(40, viewWidth - 120 + lineHeight - 40, 80, viewWidth - 120+ lineHeight, fillPaint);
fillPaint.setColor(Color.BLACK); fillPaint.setTextSize(40); canvas.drawText(list.get(i).get(labelkey).toString() + " : "+list.get(i).get(numkey).toString(), 100, viewWidth - 120+ lineHeight, fillPaint);
}
}
This code only works for positive values and not for decimal values.
For using random colors for the PieChart, in code above change
int col = 100+(155*i/list.size());
fillPaint.setColor(Color.rgb(40, col, col));
to
int r = getRandom(0, 255);
int g = getRandom(0, 255);
int b = getRandom(0, 255);
fillPaint.setColor(Color.rgb(r, g, b));
18. Save and Run the project.
Bar Chart form Json Array: https://www.sketchwarehelp.com/2019/02/bar-chart-from-json-array-in-sketchware.html?m=1


#Help need-
ReplyDeletebro I went to Use fire base post system...
like I am upload a post on firebase and it will show on my app home page as like News Feed or Tips&Trick website... on click the post I show the full Samary of the post key,, like your blog to.
In my Sketchware app I not saw the event onBindCustomView . Then what I do?
ReplyDeleteFirstyou have to select a custom view for your lIstview then it will show the event on bind custom view.
DeleteForum site http://sketchforum.tk
ReplyDeletePlease show how to put the linearview with source code to add view (linear1.add view) into a scroll view
ReplyDeleteNice post. Thank you for information.
ReplyDeletemoviebox application
show box
1. ERROR in /storage/emulated/0/.sketchware/mysc/615/app/
ReplyDeletesrc/main/java/com/my/newproject2/PiechartActivity.java (at
line 119)
fillPaint.setColor(Color.BLACK); fillPaint.setTextSize(40);
canvas.drawText(list.get(i).get(labelkey).toString() + ":" + F
list.get(i).get(num key).toString 0, 100, view Width - 120+
line Height, fill Paint);
Syntax error on token "Invalid Character", delete this token
1 problem (1 error)
Did you solve the problem? I got a similar error
DeleteRemove the space at the place where it is showing special character
DeleteHello, please help how can I get data from the user to plot the line graph?
DeleteI can't use scroll linear.
ReplyDeleteI didnt understand no. 17
ReplyDeleteFirst, you must to make moreblock woth name extra and put the code in the moreblock
Delete