Bar chart from json array in Sketchware
1. Create a new project in Sketchware.
2. In main.xml add a Button button1 and a ListView listview2.
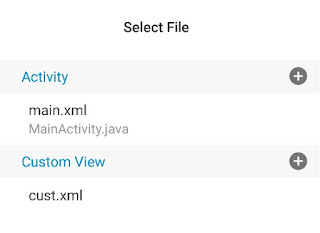
4. Select items.xml as CustomView of listview2.
5. In MainActivity.java, add a Shared Preferences component sp:sp, and an Intent component i.
6. Add a String variable jsondata, and a ListMap maplist.
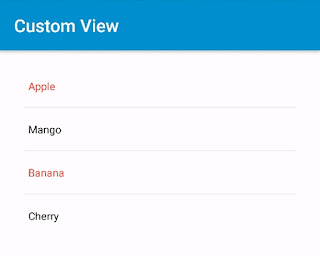
7. In onCreate event use blocks to set jsondata to your Json data containing 'text' and 'number' as keys. Convert it to List Map maplist and display it in ListView.
[
{
"text" : "Afghan Afghani",
"number" : "0.9532"
},
{
"text" : "Armenian Dram",
"number" : "0.1487"
},
{
"text" : "Bangladeshi Taka",
"number" : "0.8572"
},
{
"text" : "Cambodian Riel",
"number" : "0.1758"
},
{
"text" : "Indonesian Rupiah",
"number" : "0.005"
},
{
"text" : "Maldivian Rufiyaa",
"number" : "4.674"
},
{
"text" : "Pakistani Rupee",
"number" : "0.5832"
},
{
"text" : "Philippine Peso",
"number" : "1.332"
},
{
"text" : "Thai Baht",
"number" : "2.226"
}
]
8. In onBindCustomView event, display the data from maplist in the TextViews in CustomView items.xml.
9. Create a new View barchart.xml.
10. In the event button1 onClick in MainActivity.java, save the maplist to Shared Preferences and used Intent to move to BarchartActivity.java.
12. In BarchartActivity.java add a Shared Preferences component sp:sp, a Map variable map, and a ListMap listmap.
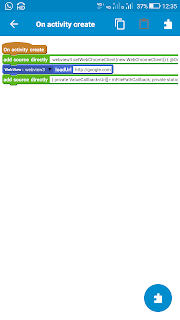
13. In onCreate event use blocks to get data from Shared Preferences to listmap, and codes to display this ListMap in BarChartView.
The code used in add source directly block is
BarChartView chart = new BarChartView(this, listmap, "number", "text");
linear1.addView(chart);
Here 'text' and 'number' are the keys used in Json String in MainActivity.java.
14. Create a More Block extra.
15. In the more block extra, use an add source directly block and put codes to define a View class BarChartView.
}
public class BarChartView extends View {
private int barCol;
private int progressCol;
private int progress=0;
private Paint myPaint;
private ArrayList<HashMap<String, Object>> list = new ArrayList<>();
private String numkey;
private String labelkey;
public BarChartView(Context context, ArrayList<HashMap<String, Object>> list, String numkey, String labelkey){
super(context);
myPaint = new Paint();
barCol = Color.BLACK;
progressCol = Color.RED;
progress = 0;
this.list = list;
this.numkey = numkey;
this.labelkey = labelkey;
}
@Override
protected void onDraw(Canvas canvas) {
int viewWidth = this.getMeasuredWidth();
int viewHeight = this.getMeasuredHeight();
myPaint.setStyle(android.graphics.Paint.Style.STROKE);
myPaint.setStrokeWidth(4);
myPaint.setColor(barCol);
canvas.drawLine(40, viewHeight -40, 40, 40, myPaint);
canvas.drawLine(40, viewHeight -40, viewWidth -20, viewHeight -40, myPaint);
int lastBase = 40;
int barWidth = (int)(viewWidth - 80)/list.size();
float max = Float.valueOf(list.get(0).get(numkey).toString());
for (int i =0; i<list.size(); i++){
if(max < Float.valueOf(list.get(i).get(numkey).toString())) {
max = Float.valueOf(list.get(i).get(numkey).toString());
} }
int maxHeight = viewHeight - 120;
myPaint.setStyle(android.graphics.Paint.Style.FILL);
for (int i =0; i<list.size(); i++){
int col = 100+(155*i/list.size());
myPaint.setColor(Color.rgb(0, col, col));
canvas.drawRect(lastBase+10, viewHeight - (Float.valueOf(list.get(i).get(numkey).toString()))*maxHeight/max, lastBase + barWidth, viewHeight - 40, myPaint);
canvas.save();
canvas.rotate(270f, 0, 0);
myPaint.setColor(Color.BLACK); myPaint.setTextSize(barWidth/2); canvas.drawText(list.get(i).get(labelkey).toString() + " : " + list.get(i).get(numkey).toString(), -viewHeight +100, lastBase+10 +barWidth*2/3, myPaint);
canvas.restore();
lastBase = lastBase + barWidth;
}
}
This code only works for positive numerical values.
16. Save and Run the project.


It's Really a great code collection, awesome
ReplyDeleteNice post. Thank you for sharing the information.
ReplyDeletemoviebox application
show box
This comment has been removed by the author.
ReplyDelete